2nd Workshop on
Visualization for AI Explainability
October 21, 2019 at IEEE VIS in Vancouver, Canada
The role of visualization in artificial intelligence (AI) gained significant attention in recent years. With the growing complexity of AI models, the critical need for understanding their inner-workings has increased. Visualization is potentially a powerful technique to fill such a critical need.
The goal of this workshop is to initiate a call for 'explainables' / 'explorables' that explain how AI techniques work using visualization. We believe the VIS community can leverage their expertise in creating visual narratives to bring new insight into the often obfuscated complexity of AI systems.
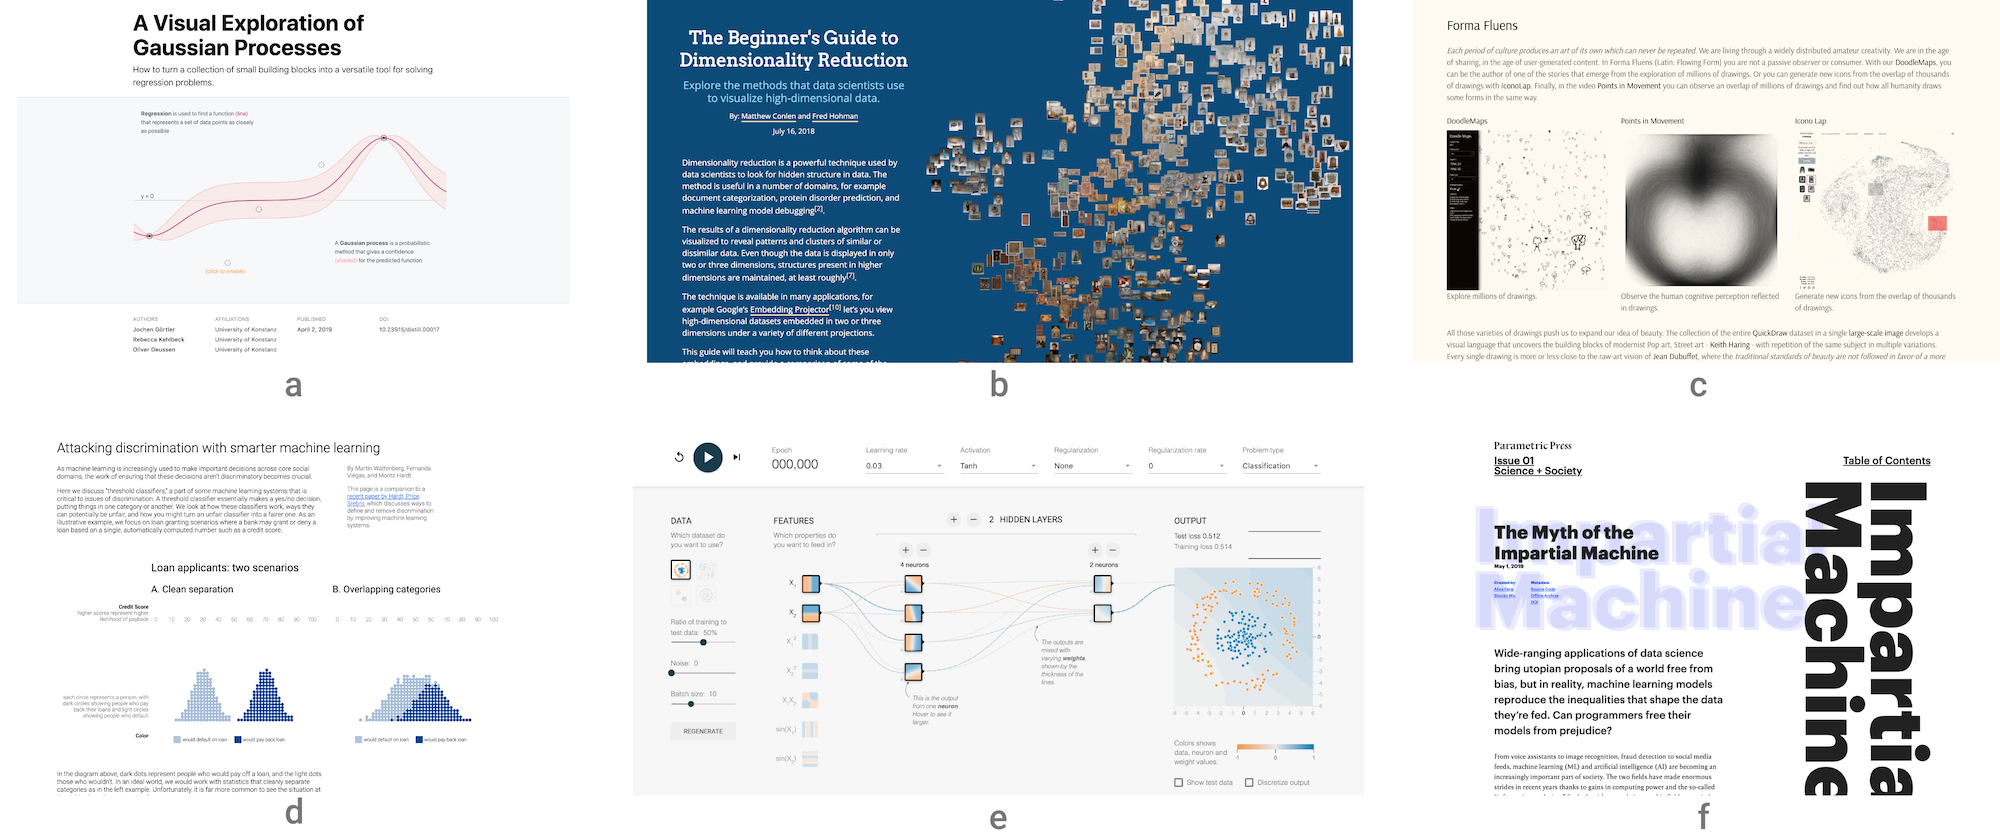
- (a) A Visual Exploration of Gaussian Processes by Görtler, Kehlbeck, and Deussen (VISxAI 2018)
- (b) The Beginner's Guide to Dimensionality Reduction by Conlen and Hohman (VISxAI 2018)
- (c) FormaFluens Data Experiment by Strobelt, Phibbs, and Martino
- (d) Attacking Discrimination with Smarter Machine Learning by Wattenberg, Viégas, and Hardt
- (e) Tensorflow Playground by Smilkov, Carter, et.al.
- (f) The Myth of the Impartial Machine by Feng and Wu
Important Dates
Program Overview
All times in ET (UTC -5).
| 2:20 -- 2:25 | Welcome from the Organizers |
| 2:25 -- 3:20 | Keynote: Chris Olah (OpenAI) Zoom in: Features and Circuits as the Basic Unit of Neural Networks - Some of the most important transitions in science have involved a new visualization causing research to "zoom in" to a new level granularity. The microscope opened up cellular biology. Crystallography (among other methods) enabled the molecular revolution, where biology began characterizing and understanding specific proteins and genetic circuits. Is deep learning on the verge of a similar transition? Visualization techniques are beginning to reveal a rich world of interacting features inside neural networks. What happens if we take it seriously as an object of study? |
| 3:20 -- 3:50 | Session I What if we Reduce the Memory of an Artificial Doom Player? Theo Jaunet, Romain Vuillemot, and Christian Wolf Interactive Feature Visualization in the Browser Stefan Sietzen and Manuela Waldner Demystifying Artificial Intelligence with Siemens AI Explainables Daniela Oelke, Henning Reich, Andreas Stoffel, Christian Rohrdantz, Johannes Häußler, Victor Balanica, and Cecilia Bruhn |
| 3:50 -- 4:10 | Coffee Break |
| 4:10 -- 4:40 | Session II Analyzing the Design Space for Visualizing Neural Attention in Text Classification Denis Parra, Hernan Valdivieso, Andres Carvallo, Gabriel Rada, Katrien Verbert, and Tobias Schreck Remembrances of States Past Kris Sankaran |
| 4:40 -- 5:15 | Session III Selecting the right tool for the job: a comparison of visualization algorithms Daniel Burkhardt, Scott Gigante, and Smita Krishnaswamy Visual Explanations for Gradient Boosting Models Matthew Britton Tests, Memory, and Artificial Intelligence: How Can We Know What People Know? Noah Cowit, Catherine Yeh, and Iris Howley |
| 5:15 -- 5:35 | Moderated Panel Discussion |
| 5:35 -- 5:40 | Best submission ceremony |
| 8:00 | VISxAI Eastcoast party |
Hall of Fame
Each year we award Best Submissions and Honorable Mentions. Congrats to our winners!