October 25th, 2021 at IEEE VIS in New  Orleans, Louisiana Online
The role of visualization in artificial intelligence (AI) gained significant attention in recent years. With the growing complexity of AI models, the critical need for understanding their inner-workings has increased. Visualization is potentially a powerful technique to fill such a critical need.
The goal of this workshop is to initiate a call for "explainables" / "explorables" that explain how AI techniques work using visualization. We believe the VIS community can leverage their expertise in creating visual narratives to bring new insight into the often obfuscated complexity of AI systems.
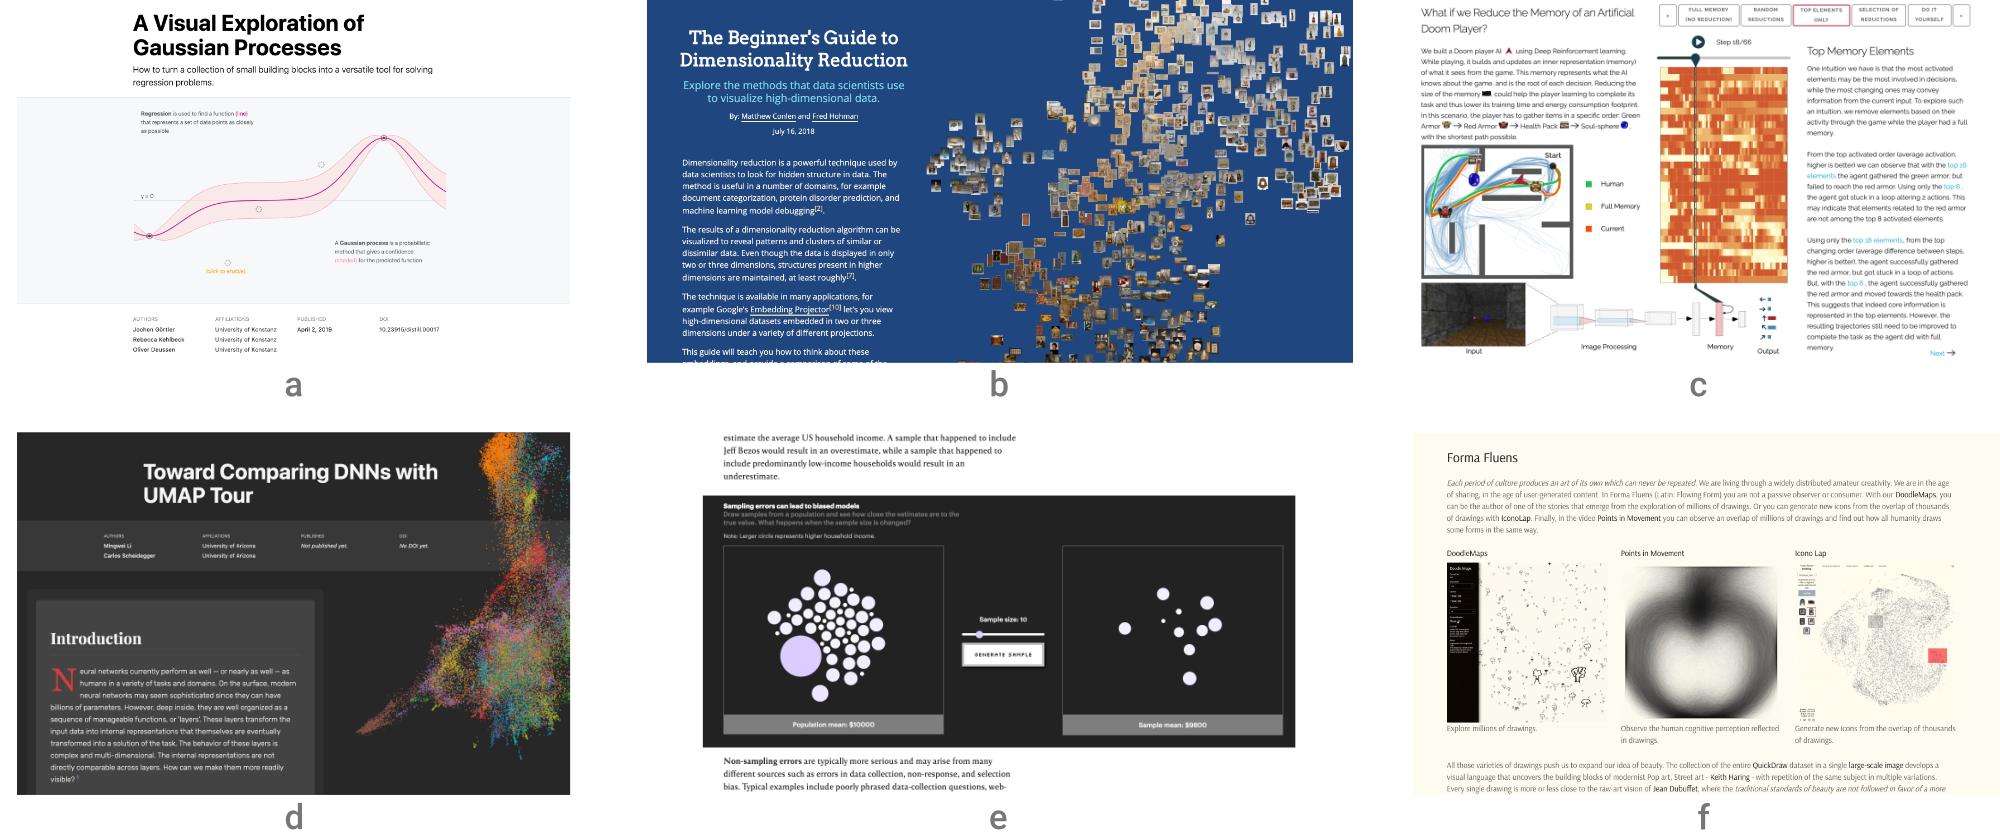
            
            
Note: Dates could be revised due to the ongoing COVID-19 outbreak.
July 30, 2021August 6, 2021, anywhere: Explainables Submission September 10, 2021: Author Notification October 25 -- Workshopin New Orleansonline at IEEE VIS 2021
    All times in CDT (UTC -5) on Monday, October 25, 2021.
    
    
→ To attend, register for free at IEEE VIS.
    
    
→ Join the virtual even here!
| 12:00 -- 12:05 | Welcome from the Organizers | 
| 12:05 -- 1:00 | Keynote: David Ha (Google) - @hardmaru
             Using the Webpage as the Main Medium for Communicating Research Ideas While papers are the main means for communicating scientific results, both quantitative and qualitative, the machine learning community’s expectations have moved above and beyond the paper format. Machine learning models are expected to be ultimately used by people, in devices, computers, and other applications. In recent years we have witnessed the popularity of work published as web articles and interactive demos, enabling the reader to interact with machine learning models to experience the features and limitations of cutting edge methods. This comes with costs, as development and deployment of interactive websites consume time and energy from the researcher's point of view. In particular, the audience may find flaws in the model by interacting with it in ways unintended by the authors, who may simply wish to report a score against a benchmark. In this talk, I will discuss my own experiences developing these interactive web browser demos for my own research and others’ in the literature as a series of case studies. By the end of the talk, the audience will be familiar with the different approaches and their tradeoffs used in the development of web demos for research, to be able to assess whether it is something they wish to do for their own projects.  | 
    
| 1:00 -- 1:30 | Session I
             What Have Language Models Learned? -- Adam Pearce Feature Sonification: An investigation on the features learned for Automatic Speech Recognition -- Amin Ghiasi, Hamid Kazemi, W. Ronny Huang, Emily Liu, Micah Goldblum, Tom Goldstein Interactive Similarity Overlays -- Ruth Fong, Alexander Mordvintsev, Andrea Vedaldi, Chris Olah  | 
    
| 1:30 -- 2:00 | Break | 
| 2:00 -- 2:30 | Session II
             An Interactive Introduction to Model-Agnostic Meta-Learning -- Luis Müller, Max Ploner, Thomas Goerttler, Klaus Obermayer Demystifying the Embedding Space of Language Models -- Rebecca Kehlbeck, Rita Sevastjanova, Thilo Spinner, Tobias Stähle, Mennatallah El-Assady Backprop Explainer: An Explanation with Interactive Tools -- Donald Bertucci, Minsuk Kahng  | 
    
| 2:30 -- 2:35 | Project Pitch Videos | 
| 2:35 -- 3:05 | Session III
             (Un)Fair Machine -- Vu Luong Amazon's MLU-Explain: Interactive Explanations of Core Machine Learning Concepts -- Jared Wilber, Jenny Yeon, Brent Werness Exploring Hidden Markov Model -- Rithwik Kukunuri, Rishiraj Adhikary, Mahika Jaguste, Nipun Batra, Ashish Tendulkar  | 
    
| 3:05 -- 3:10 | Closing Session | 
| 3:10 -- 5:00 | VISxAI Eastcoast Party | 
Project Pitch Videos
Explainable submissions (e.g., interactive articles, markup, and notebooks) are the core element of the workshop, as this workshop aims to be a platform for explanatory visualizations focusing on AI techniques.
Authors have the freedom to use whatever templates and formats they like. However, the narrative has to be visual and interactive, and walk readers through a keen understanding on the ML technique or application. Authors may wish to write a Distill-style blog post (format), interactive Idyll markup, or a Jupyter or Observable notebook that integrates code, text, and visualization to tell the story.
Here are a few examples of visual explanations of AI methods in these types of formats:
While these examples are informative and excellent, we hope the Visualization & ML community will think about ways to creatively expand on such foundational work to explain AI methods using novel interactions and visualizations often present at IEEE VIS. Please contact us, if you want to submit a original work in another format. Email: orga.visxai (at) gmail.com.
Note: We also accept more traditional papers that accompany an explainable. Be aware that we require that the explainable must stand on its own. The reviewers will evaluate the explainable (and might chose to ignore the paper).
In previous years, the best works were invited to submit their extended work to the online publishing platform distill.pub to generate a cite-able publication for authors. See https://distill.pub/2019/visual-exploration-gaussian-processes/.
            Adam Perer - Carnegie Mellon University
            
            
            Fred Hohman - Apple
            Hendrik Strobelt - MIT-IBM Watson AI Lab
            Mennatallah El-Assady - ETH AI Center
        
            Duen Horng (Polo) Chau - Georgia Tech
            Fernanda Viégas - Google Brain
        
            Marco Angelini
            Jürgen Bernard
            Angie Boggust
            Nan Cao
            Marco Cavallo
            Jaegul Choo
            Tommy Dang
            Victor Dibia
            Angus Forbes
            Iris Howley
            Denis Parra
            Arjun Srinivasan
            Romain Vuillemot
            Yang Wang
            James Wexler