5th Workshop on
Visualization for AI Explainability

October 17th, 2022 at IEEE VIS in Oklahoma City, Oklahoma

The role of visualization in artificial intelligence (AI) gained significant attention in recent years. With the growing complexity of AI models, the critical need for understanding their inner-workings has increased. Visualization is potentially a powerful technique to fill such a critical need.

The goal of this workshop is to initiate a call for "explainables" / "explorables" that explain how AI techniques work using visualization. We believe the VIS community can leverage their expertise in creating visual narratives to bring new insight into the often obfuscated complexity of AI systems.

Example interactive visualization articles that explain general concepts and communicate experimental insights when playing with AI models. 
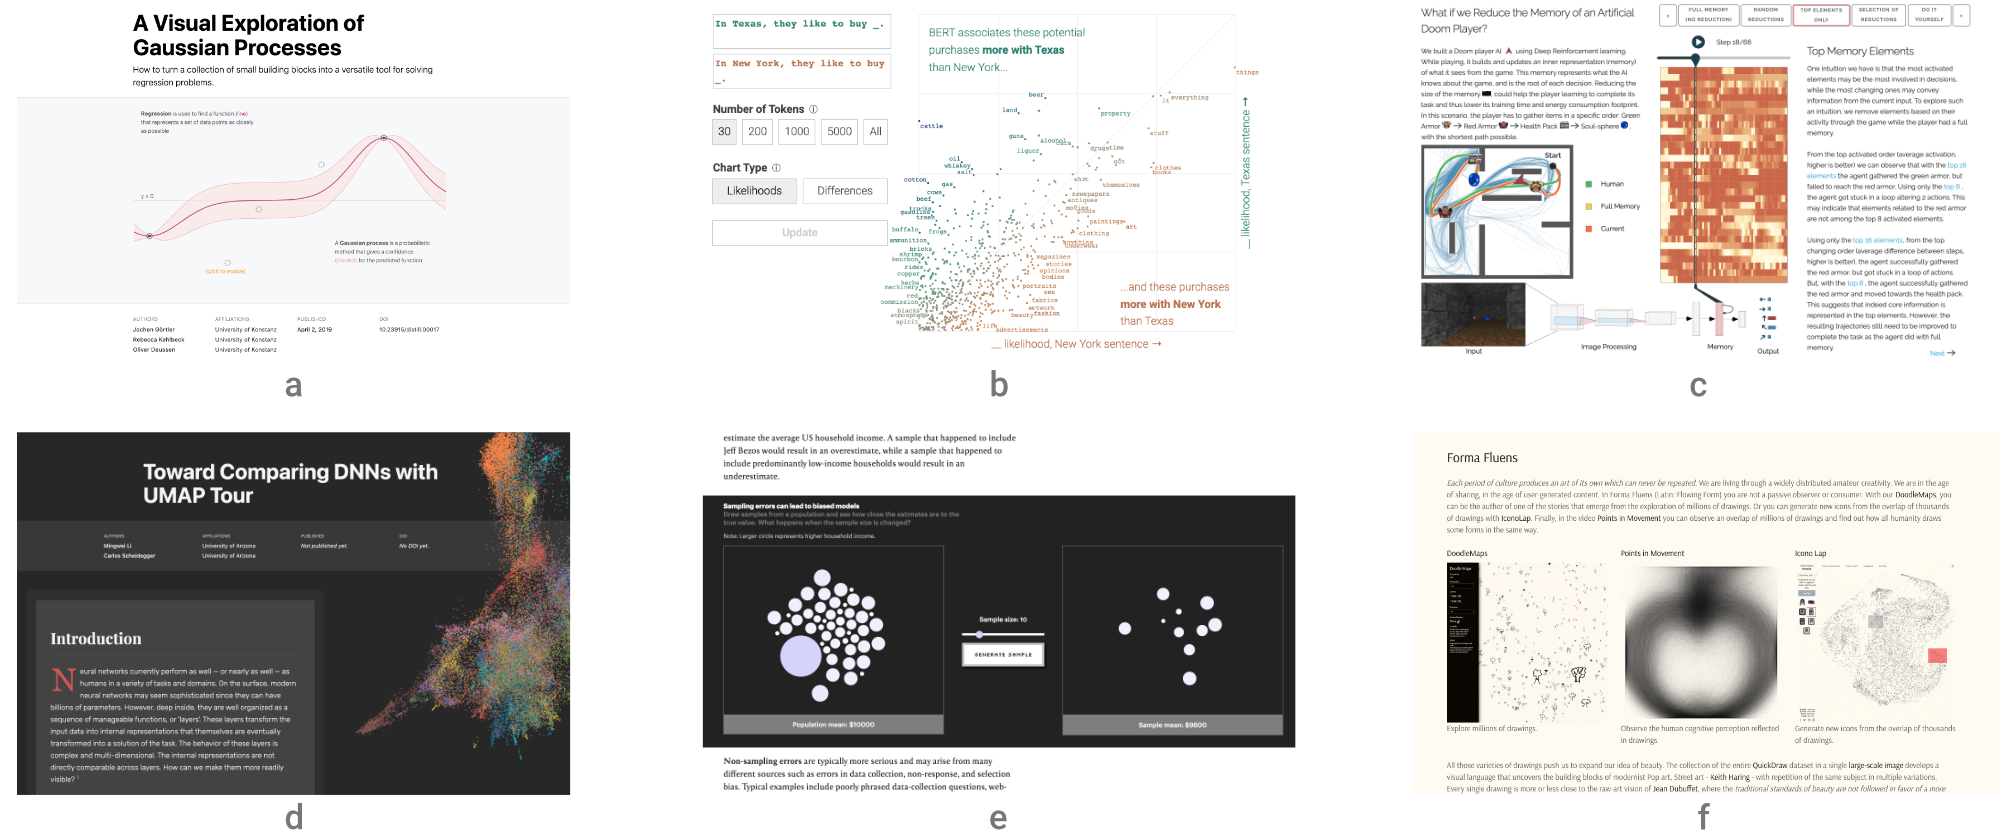
(a) A Visual Exploration of Gaussian Processes by Görtler, Kehlbeck, and Deussen (VISxAI 2018); (b) What Have Language Models Learned? by Adam Pearce (VISxAI 2021); (c) What if we Reduce the Memory of an Artificial Doom Player? by Jaunet, Vuillemot, and Wolf (VISxAI 2019); (d) Comparing DNNs with UMAP Tour by Li and Scheidegger (VISxAI 2020); (e) The Myth of the Impartial Machine by Feng and Wu (Parametric Press); (f) FormaFluens Data Experiment by Strobelt, Phibbs, and Martino.

Important Dates

Note: Dates are approximate and will be finalized soon. Also, dates could be revised due to the ongoing COVID-19 outbreak.

July 22, 2022 July 29, 2022, anywhere: Explainables Submission
August 22, 2022 August 29, 2022: Author Notification
October 17th, 2022 -- Workshop in Oklahoma City at IEEE VIS 2022
    

Program Overview

All times in CDT (UTC -5) on Monday, October 17, 2022.

→ To attend, register at IEEE VIS.

2:00 -- 2:05 Welcome from the Organizers
2:05 -- 2:55 Keynote: Ian Johnson (Observable) - @enjalot
Towards a Pattern Language for Visualizing AI
Building visualizations for better understanding machine learning models is important but challenging work that seems to call for learning an entirely new discipline. Machine learning practitioners and data visualization developers share an important foundation: an intimate relationship with data. This talk will present the beginnings of a pattern language that will allow us to build on that foundation together. Drawing from my experiences working on Distill, creating data visualization tools at Observable as well as surveying the excellent work presented in the last 4 years at VISxAI, we will examine patterns that can be practically applied to building your next visualization.
2:55 -- 3:15 Session I
K-Means Clustering: An Explorable Explainer -- Yi Zhe Ang
Action as Information -- Paschalis Bizopoulos
3:15 -- 3:45 Break
3:45 -- 4:15 Session II
How is Real-World Gender Bias Reflected in Language Models? -- Javier Rando, Alexander Theus, Rita Sevastjanova, Mennatallah El-Assady
Explaining Image Classifiers with Wavelets -- Julius Hege
What should we watch tonight? -- Ibrahim Al-Hazwani, Gabriela Morgenshtern, Yves Rutishauser, Mennatallah El-Assady, Jürgen Bernard
4:15 -- 4:45 Session III
Poisoning Attacks and Subpopulation Susceptibility -- Evan Rose, Fnu Suya, David Evans
Mapping Wikipedia with BERT and UMAP -- Brandon Duderstadt
An Interactive Introduction to Causal Inference -- Lucius E.J. Bynum, Falaah Arif Khan, Oleksandra Konopatska, Joshua Loftus, Julia Stoyanovich
4:45 -- 5:00 Closing Session

Call for Participation

Submission instructions

Explainable submissions (e.g., interactive articles, markup, and notebooks) are the core element of the workshop, as this workshop aims to be a platform for explanatory visualizations focusing on AI techniques.

Authors have the freedom to use whatever templates and formats they like. However, the narrative has to be visual and interactive, and walk readers through a keen understanding on the ML technique or application. Authors may wish to write a Distill-style blog post (format), interactive Idyll markup, or a Jupyter or Observable notebook that integrates code, text, and visualization to tell the story.

Here are a few examples of visual explanations of AI methods in these types of formats:

While these examples are informative and excellent, we hope the Visualization & ML community will think about ways to creatively expand on such foundational work to explain AI methods using novel interactions and visualizations often present at IEEE VIS. Please contact us, if you want to submit a original work in another format. Email: orga (at) visxai.io.

Note: We also accept more traditional papers that accompany an explainable. Be aware that we require that the explainable must stand on its own. The reviewers will evaluate the explainable (and might chose to ignore the paper).

In previous years, the best works were invited to submit their extended work to the online publishing platform distill.pub to generate a cite-able publication for authors. See https://distill.pub/2019/visual-exploration-gaussian-processes/.

Hall of Fame

Each year we award Best Submissions and Honorable Mentions. Congrats to our winners!

VISxAI 2021
VISxAI 2020
VISxAI 2019
VISxAI 2018

Organizers (alphabetic)

Adam Perer - Carnegie Mellon University
Angie Boggust - Massachusetts Institute of Technology
Fred Hohman - Apple
Hendrik Strobelt - MIT-IBM Watson AI Lab
Mennatallah El-Assady - ETH AI Center
Zijie Jay Wang - Georgia Tech

Steering Committee

Duen Horng (Polo) Chau - Georgia Tech
Fernanda Viégas - Google Brain

Program Committee

Soumya Dutta
Zhixuan Zhou
Marco Angelini
Jürgen Bernard
Alex Bäuerle
Jaegul Choo
Angus Forbes
Iris Howley
Romain Vuillemot
James Wexler
Donald Bertucci
Ángel Cabrera
Victor Dibia
Denis Parra
Rita Sevastjanova
Yang Wang